Research
California WC Formulary – Part II: A Review of the July 2017 Proposed Formulary Drug List of Exempt and Non-Exempt Drugs
A CWCI Spotlight Report uses 2015 and 2016 workers’ comp prescription drug data to measure the potential impact of DWC’s proposed Formulary.
Injury Classification in California Workers’ Comp, Part 1: Medical Coding During the ICD-10 Transition
A new analysis on the use of ICD-10 codes in California workers comp during the transition from the ICD-9 system finds that 99 percent of submitted medical bills used ICD-10 codes and, as expected, a wider range of codes were provided than in the past, but many lacked the additional characters that better define the injury, identify the type of encounter and improve communication.
CWCI IRIS Regional Score Card: Sierra Claims
Claims filed by workers living in the Sierras represent just 1.7% of California workers’ comp claims, but over the past decade average loss payments in the region have grown faster than in other parts of the state. CWCI’s final Regional Score Card takes a close look at key aspects of Sierra claims and compares the results to those from other regions.
IMR Decisions: January 2014 Through December 2016
A 12-page CWCI analysis that measures and compares IMR outcomes from 2014, 2015, and 2016.
CWCI IRIS Regional Score Card: Claims from the Northern Counties
Claims filed by residents of Californias nine northern most counties comprise 1.1% of the state’s work force, but 3.3% of the states workers’ comp claims and 2.2% of paid losses. CWCI’s seventh IRIS Regional Score Card offers detailed data comparing key aspects of claims from the Northern Counties to those from other regions.
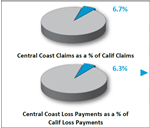
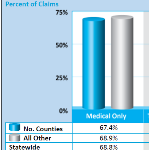
CWCI IRIS Regional Score Card: Central Coast Claims
Claims filed by workers living on the Central Coast account for 6.7% of all workers’ comp claims in the state and 6.3% of paid losses. CWCI’s sixth IRIS Regional Score Card offers detailed data comparing key aspects of Central Coast claims to those from other regions.