
Inpatient Hospital Utilization in California WC 2008-2014
Attached is a copy of a CWCI Spotlight Report that compares 2008 through 2014 inpatient hospital discharge data for different systems: private coverage, Medicare, Medi-Cal and California workers’ compensation. In addition to looking at the overall volume and distribution of inpatient discharges across these payer groups, the report also identifies the ten most common inpatient diagnosis-related group codes (MS-DRGs) in workers’ comp for 2013 and 2014; calculates the average charged and paid amounts for the top 10 MS-DRGs; and notes changes in the volume of implant-eligible spinal surgeries and in the proportion of spinal fusion MS-DRG discharges to total discharges across time for each payer group. The results show that:
- The number of California workers’ comp inpatient discharges fell 8.6% between 2013 and 2014, and 22.8% between 2008 and 2014 – more than any other payer group (Medi-Cal inpatient stays increased dramatically after Medi-Cal’s absorption of the Healthy Families Program and the expanded enrollment under the Affordable Care Act).
- MS-DRG 470 (major joint replacement or reattachment of a lower extremity), remains the # 1 inpatient hospital discharge in California workers’ comp, though medical back problems (8.2% of the total) and spinal fusions (16.8% of the total) still account for 6 of the top 10 workers’ comp discharges.
- In 2013, the year that spinal hardware pass-through payments began to be phased out, the number of implant-eligible spinal surgeries declined 8.4%. The volume of these surgeries continued to decline following the repeal of the pass through payments in 2014, falling another 13.6%.
- Even with the reduced number of workers’ comp implant-eligible spinal surgeries, spinal fusions as a proportion of all workers’ comp MS-DRGs have shown little change. Over the 7-year study period, implant-eligible spinal surgeries have ranged between 21.0% and 23.2% of all workers’ comp inpatient stays, and in 2014 they accounted for 21.2%.
As a companion piece to the study, CWCI members are invited to access a special interactive application[1] to provide greater insight into three key areas:
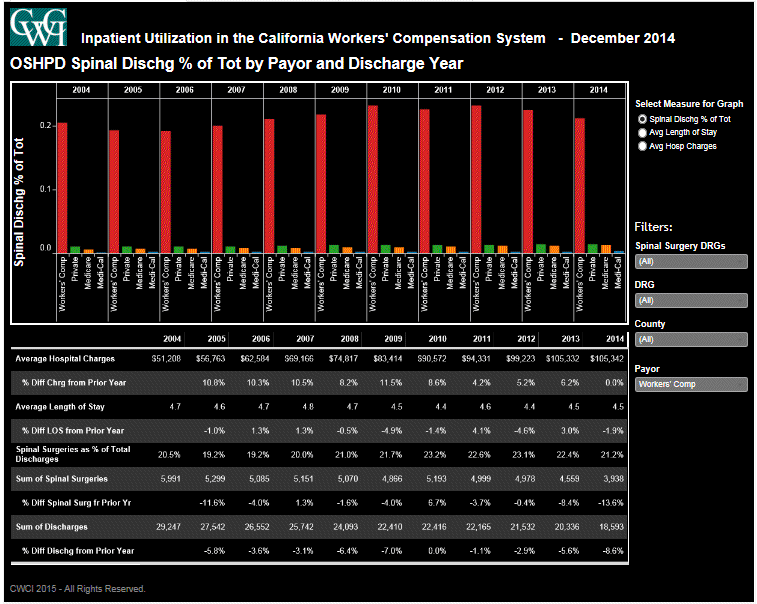 |
Comparative data on back surgery rates, average lengths of stay, and hospital charges for California Workers’ Compensation, Medicare, Medi-Cal and Private Coverage |
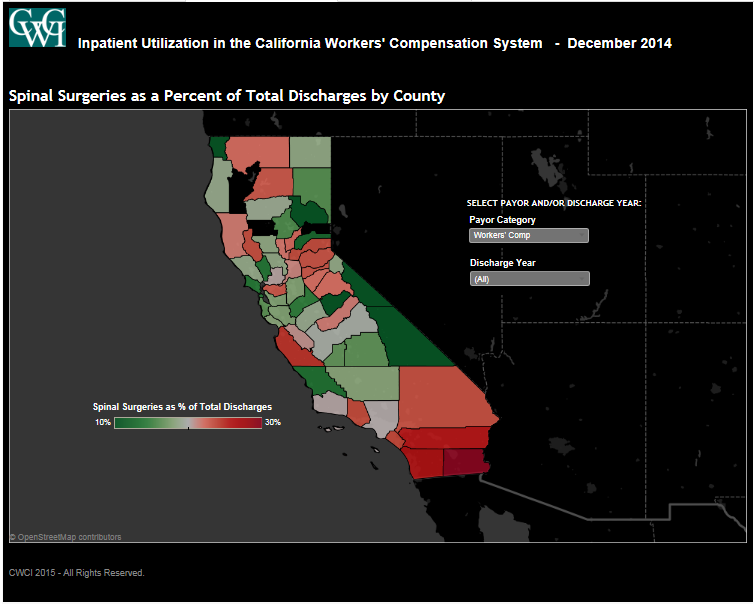 |
Heat maps to compare back surgery rates, lengths of stay and charges across payors and counties |
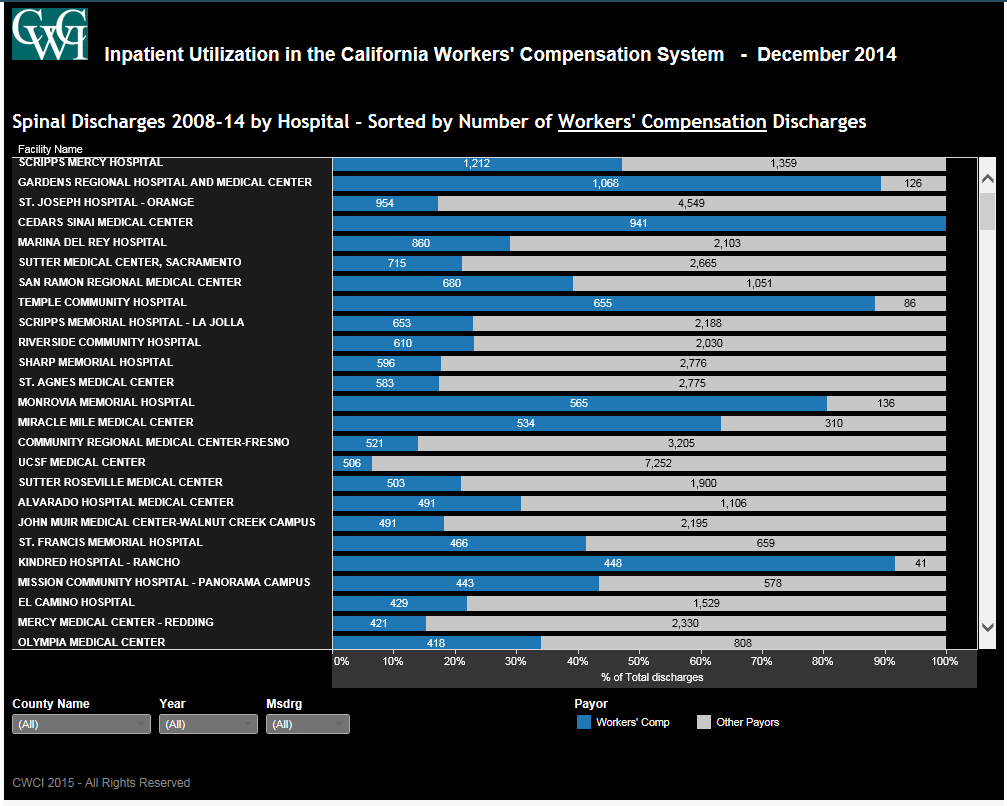 |
A hospital-specific drill-down comparison of spine surgery rates |
This application builds on the Institute’s 20+ year history of providing analytic tools to members. The Inpatient Discharge Analysis application is part of an evolving CWCI public policy program to provide members and other stakeholders “distributed analytics” to enable a more comprehensive, interactive experience with CWCI research.
If you have questions regarding the Inpatient Discharge Analysis application, feel free to contact CWCI Senior Vice-President of Research & Operations Rena David (rdavid@cwci.org
[1] To open the interactive application, click CWCI Inpatient Hospital Application