
COVID-19/Non-COVID-19 App Updated With Claims Data Reported as of 12/13/2021
This week CWCI updated the COVID-19/Non-COVID-19 Interactive Claims Data App, which now includes data on California work injury and illness claims from March of AY 2019 through November of AY 2021 reported to the DWC’s Workers’ Compensation Information System (WCIS) as of December 13. Those claims include 172,257 COVID claims with dates of injury through November 30 (1,240 of which were death claims). In the 21 months since the pandemic was declared in March 2020, 1,131,489 workers’ compensation claims have been reported to the WCIS, of which 15.2% have been COVID-19 claims. Among other key findings from the latest update:
- The recent surge in COVID diagnoses and hospitalizations in the state has yet to translate to an increase in the monthly count of COVID workers’ comp claims. The monthly COVID claim count peaked at 7,901 claims during this summer’s surge, but has been tailing off ever since, with the monthly totals thus far falling to 3,829 in September; 3,497 in October; and 2,214 in November. Additional claims from those months are still being reported, but CWCI’s ultimate claim projections also show the sharp upturn in July and August, with declining numbers ever since. The latest projections estimate that the COVID-19 claim count will be 8,224 for August; 4,068 for September; 3,917 for October; and 3,033 for November. If the September through November projections hold true, COVID-19 claim counts will be well below the comparable figures from a year earlier, when the 2020 year-end surge began.
- Since the pandemic began, COVID claims have ranged from a high of 52.4% of California workers’ comp claims reported for last December to a low of 1.5% of the claims reported for May and June of this year. The percentage jumped to 13.1% at the peak of this summer’s Delta variant surge, then fell to 7.1% in September; 6.8% in October; and 5.7% in November.
- The distribution of COVID claims by region has shifted over the past year as the volume of claims has surged and retreated. The table below shows the change in the regional distribution of COVID-19 claims between 4 distinct periods: the December 2020 to January 2021 surge; the February to June 2021 downturn; the Delta variant surge from July to August 2021; and the most recent 3-month decline spanning September through November 2021.
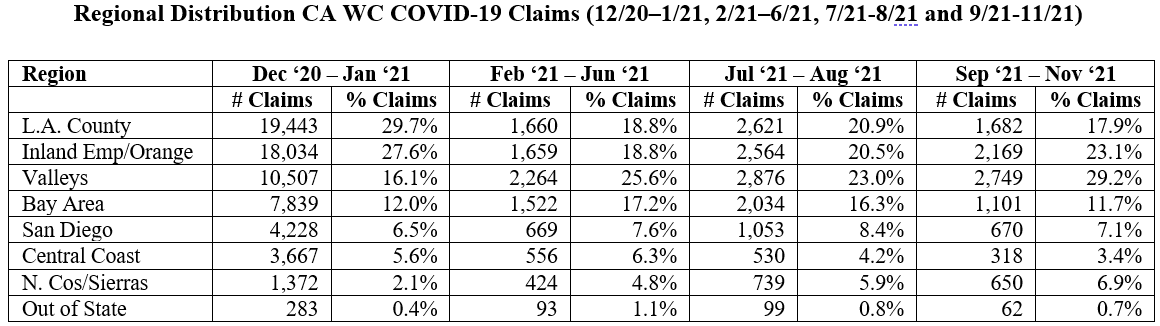
L.A. County and the Inland Empire/Orange Co. were the hotspots for COVID claims during the December 2020 to January 2021 peak period, accounting for 29.7% and 27.6% of California’s COVID claims respectively as COVID claim volume hit an all-time high. However, as claim volume subsided from February through June, both of these regions saw their share of the state’s COVID claims drop to 18.8%, while all other regions saw their shares increase, led by the Central Valley, which went from 16.1% to 25.6% of the COVID claims. The 2021 summer surge, which coincided with the reopening of the state’s economy, led to another regional shift, as L.A. County and the Inland Empire/Orange edged back up toward 21% of the COVID claims, San Diego’s share rose to 8.4%, and the rural North Counties/Sierras (which have the lowest vaccination rate) climbed to 5.9%. Meanwhile, the Bay Area, Central Coast and Central Valley all saw their share of COVID claims decline. As COVID claim volume began trending down from the summer peak, the regional mix shifted again, as L.A. County fell to 17.9% of the COVID claims, while the Inland Empire/Orange County saw its share climb 2.6 percentage points to 23.1%; the Central Valley jumped from 23.0% to 29.2%; and the North Counties/Sierras’ share moved up to 6.9%. In contrast, the Bay Area has seen the biggest decline in its share of the COVID claims recently, as it fell from 16.3% of the claims during the summer surge to 11.7% during the fall downturn, while San Diego dropped from 8.4% to 7.1%; and the Central Coast dropped from 4.2% to 3.4%.
- There is an also an ongoing shift in the mix of COVID claims by industry, primarily because public safety/government workers’ share continues to increase, while health care workers share declines. Public safety/government workers accounted for 35.8% of COVID claims reported for October and November, up from 22.8% of the claims from the first 9 months of this year and 16.7% of the 2020 COVID claims. Meanwhile, health care workers’ share has fallen from 32.5% in 2020 to 24.1% of the claims from the first 9 months of 2021, and 17.0% of the October and November claims. Other sectors that saw their share of COVID claims increase recently: education, which rose from 1.5% of the claims in AY 2020 to 2.7% in the first 9 months of 2021, then to 5.3% of the October and November claims; and transportation, which went from 6.1% of the COVID claims last year. to 8.6% in the first 9 months of this year, and 10.2% of the claims from October and November.
- Since March of 2020, 35.6% of all COVID claims have been denied. The denial rate for COVID claims has consistently been at least 2 to 4 times the denial rate for non-COVID claims. Denial data for October and November claims is not fully developed, but the denial rates for COVID claims from January through September of this year have ranged from 35.8% to 49.2%, while denial rates for non-COVID claims have ranged from 6.3% to 12.7%.
- A CWCI member survey from earlier this year ascribed 58.0% of COVID claim denials to a lack of medical verification (either due to a negative COVID test or lack of a PCR test); 32.1% of the claims were denied because the COVID exposure was non-industrial (the worker had not been exposed at work, withdrew their claim, or failed to cooperate); and 9.9% involved a reporting error (either the claimant was not an employee or their positive COVID test was not alleged to be from a work-related exposure).
- COVID claim denial rates continue to vary significantly by industry. For example, among October 2021 COVID claims, the overall denial rate was 27.7%, but the denial rate was only 10.7% for government/public safety workers and 20.1% for health care workers, many of whom have COVID-19 presumptions, while COVID claim denial rates ran as high as 52.4% in the accommodations sector, 55.6% in the arts and recreation sector, 62.5% in the information sector; and 86.3% in the transportation sector.
Additional details and interactive exhibits are available in the COVID-19/Non-COVID-19 Interactive Data App, which is updated biweekly. The app can be accessed by clicking here.
BY/