
COVID-19/Non-COVID-19 App Updated With Claims Data Reported as of 09/20/2021
CWCI’s latest update to the COVID-19/Non-COVID-19 Interactive Claims Data Application (https://www.cwci.org/CV19claims.html) features data on claims from March of AY 2019 through August of AY 2021 reported to the DWC’s Workers’ Compensation Information System (WCIS) as of September 20. Those claims include 159,774 COVID-19 claims that had dates of injury within the 20-month period spanning January 2020 through August of this year (1,123 of which were death claims). A total of 960,504 workers’ compensation claims were reported to WCIS for the 18 months ending August 31, of which 159,523 (16.6%) were COVID-19 claims. Other highlights from the latest update:
- Updated monthly claim counts show that after trending down steadily from a record 43,344 COVID claims reported last December to just 715 COVID claims in May and 741 in June, the number of COVID claims reversed course in July and August as the Delta variant hit the state. The latest monthly COVID claim counts show that thus far there have been 4,455 COVID claims for July and 6,428 for August.
- Additional claims from June through July continue to be reported, so CWCI’s ultimate claim projections underscore the recent uptrend, with the latest estimates projecting 785 COVID claims for June; 5,123 for July; and 8,999 for August. If the August projection is accurate, the monthly COVID-19 claim count will exceed the year-earlier figure for the first time in 6 months, when the corresponding figure came from February 2020, a month before the governor declared a pandemic and ordered the shutdown of non-essential businesses.
- COVID-19 claims represented 17.9% of all California workers’ compensation claims reported in AY 2020 and 10.2% of all claims reported thus far for the first 8 months of AY 2021, though with the Delta variant surge, they represented 12.8% of all claims reported thus far for August. Monthly COVID claim volume has fluctuated dramatically this year, ranging from 1.5% of the claims reported for May and June to 36.0% of the claims reported in January.
- There has been a notable shift in the distribution of COVID claims by industry beginning in February. Health care workers accounted for the largest share (31.7%) of COVID claims from Jan 2020 through Jan 2021, but as COVID claim volume waned this spring, public safety/government workers surpassed health care workers, as their share of the COVID claims rose from 17.3% of the Jan 2020-Jan 2021 claims to 22.1% of the Feb-June COVID claims, then climbed to 24.1% during the July/Aug Delta variant surge. At the same time, the health care sector’s share of the COVID claims fell by more than 12 percentage points to 19.4% over the five months ending in June, then rose back up to 22.9% of the claims from July and August. Other sectors that saw their share of COVID claims shift: transportation increased from 6.3% of the claims through January to 9.0% of the Feb-May claims, then continued up to 12.3% of the claims from July and August; retail rose went from 10.3% of the claims through January to 13.0% of the claims during the spring, then fell back to 9.4% of the July and August claims; and the education sector increased from 1.6% of the claims through January of this year to 2.8% of the February through June claims, and 3.4% of the July and August claims, a trend that accelerated with the reopening of schools and the return to in-class learning.
- Denial rates for COVID claims remain well above those for non-COVID claims. In AY 2020, the monthly denial rates for COVID claims ranged from a low of 30.4% in June to a high of 53.1% in
January (though there were only a handful of COVID claims at that stage of the pandemic). The high denial rates among COVID claims have continued this year, reaching a high of 49.3% of the claims from April. As in prior reports, denial rates continue to vary sharply by industry. For example, a review of the COVID denial rates by industry from July of 2021 – the beginning of the Delta variant surge – show that 36.3% of the COVID claims were denied, though the denial rates ranged from 18.5% for COVID claims from public sector/government workers and 26.1% for health care workers (who have a rebuttable presumption of compensability) to 62.4% for transportation workers. Other sectors with relatively high denial rates in July: finance (59.5%); retail (54.5%); professional technical (53.6%); manufacturing (49.6%); and administration/waste (49.5%).
- The regional distribution of COVID-19 claims also shifted between the first 13 months of the pandemic, the 5 months spanning February through June of 2021 when COVID claim volume fell, and the latest wave of claims brought on by the Delta variant in July and August. The table below shows the change in the regional distribution of COVID-19 claims between those three periods.
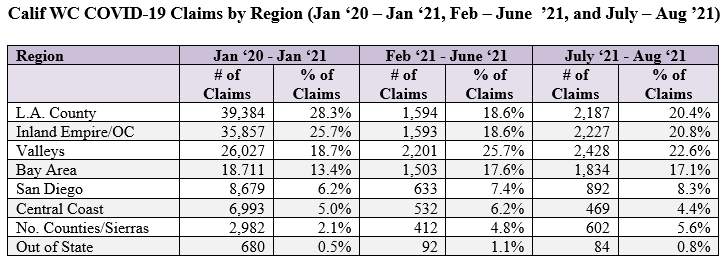
During the first 13 months of the pandemic, Los Angeles County (28.3%) and the Inland Empire/ Orange County (25.7%) together accounted for more than half of all California workers’ compensation COVID-19 claims, followed by the Central Valley (18.7%), the Bay Area (13.4%), San Diego (6.2%), and the more rural Central Coast (5.0%) and North Counties/Sierras (2.1%). With COVID claim volume plummeting as vaccines became widely available in the spring of this year, the regional mix of claims shifted, as both L.A. County and the Inland Empire/Orange County saw a sharp decline in their share of the COVID claims (down 9.7 and 7.1 percentage points respectively). Meanwhile, the Central Valley’s share jumped by 7 percentage points, the Bay Area’s share increased by 4.2 percentage points, San Diego and the Central Coast each saw their share rise by 1.2 percentage points, and the North Counties/Sierras’ share of the COVID claims more than doubled from 2.1% to 4.8%. The distribution of COVID claims by region shifted again with the Delta variant surge in July and August (which coincided with the reopening of the state’s economy on June 15) as both L.A. County and the Inland Empire/Orange County moved back over 20% of the COVID claims, which is likely related to the huge number of workers returning to jobs in those regions, while the Central Valley’s share fell by 3.1 percentage points to 22.6%, though it remained the number one region in the state in terms of COVID claim volume. Notably, San Diego saw its share of the COVID claims continue to increase during the summer surge, as did the North Counties/Sierras, which surpassed the Central Coast in terms of COVID claim volume, which may be partially due to the high level of vaccine hesitancy in this region, which has the lowest vaccination rate in the state.
CWCI continues to update its COVID-19/Non-COVID-19 Interactive Data App on a biweekly basis, and members are invited to review the latest data by clicking here.
BY/