
After Trending Down for Two Years IMR Volume Appears to Be Leveling Off
After declining 16.6% between 2019 and 2020, the number of independent medical review determination letters has plateaued in 2021, edging up 0.7% over the first three quarters of this year according to the latest analysis by the California Workers’ Compensation Institute (CWCI).
CWCI’s latest update on IMR activity uses data from more than 1.1 million IMR determination letters issued from January 2015 through September of this year, of which 102,789 were issued in the first three quarters of 2021. After the state incorporated the Chronic Pain and Opioid Guidelines into the MTUS in late 2017 and implemented the MTUS prescription drug formulary in 2018, IMR volume, spurred by reductions in pharmaceutical disputes – especially those involving opioids – fell sharply in 2019. That decline accelerated in 2020 and continued in early 2021 as the economic effects of the pandemic reduced the number of job injury claims and IMR volume. But as the year progressed and the state’s economy reopened, the number of IMR determination letters increased. Beginning in May of this year, monthly IMR volume has exceeded 2020 levels, with the latest numbers showing overall volume for the first three quarters of this year up by 683 letters compared to the first three quarters of last year.

While IMR volume has edged up this year, so too has the uphold rate. CWCI’s review of the decision letters from the first three quarters of 2021 shows that in 91.6% of the cases the IMR physician upheld the UR physician’s determination that the requested service was not supported by the treatment guidelines. That overall uphold rate is up from 88.2% in 2019, and 89.4% in 2020, and is at the highest level since IMR took effect in 2014. Uphold rates this year continue to vary by the type of medical service requested, ranging from 84.5% for E&M services (which are typically requests for office visits and consultations) to 94.5% for injections, but notably, uphold rates through September of this year compared to 2020 are up across every category of medical service, with the biggest increase noted in Laboratory Services, where the uphold rate jumped from 82.1% to 87.1%. Among the Pharmaceutical IMRs, which accounted for just over one-third of the IMR determinations this year, the uphold rate jumped from 90.4% in 2020 to 92.6% in the first three quarters of 2021. The following table shows the IMR distributions by medical service category for 2015 through Q3 2021, as well as the change in the uphold rate between 2020 and the first nine months of this year.
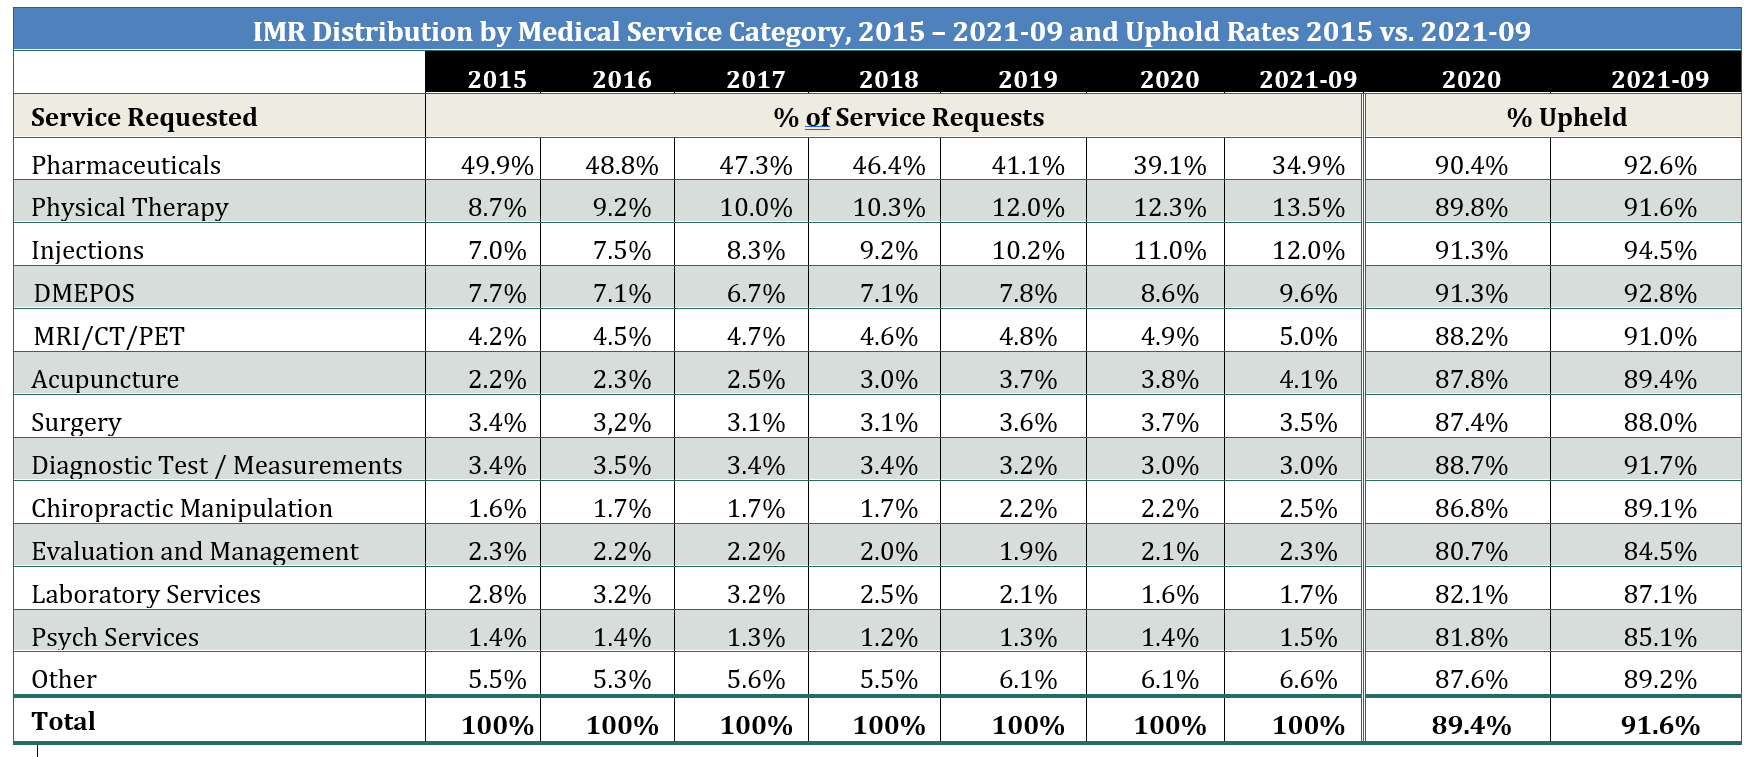
As noted in the table, pharmaceutical requests as a percentage of IMRs are down to 34.9% of the IMR decisions in the first three quarters of 2021, the lowest level since IMR began, though they still account for more IMRs than any other type of medical service, ranking well ahead of Physical Therapy requests, which represented 13.5% of all treatment disputes submitted for IMR in the first 9 months of 2021; Injections which accounted for 12.0% of the IMRs; DMEPOS which accounted for 9.6%, and MRI/CT/PET scans which accounted for 5.0%. No other medical service category accounted for more than 5% of the IMRs in the first three quarters of 2021, though both Acupuncture and Chiropractic Manipulation saw their share of the IMRs increase slightly compared to 2020, while other medical services increased from 6.1% to 6.6% of the IMRs.
A review of the distribution of prescription drug IMRs by drug category shows that even with the formulary and the opioid and chronic pain guidelines, disputes over opioid requests still top the list, accounting for 25.5% of all pharmaceutical IMRs in the first three quarters of 2021, but that is down from 32.2% in 2018, when the formulary first took effect. Meanwhile, the uphold rate on opioid IMRs has increased from 89.5% in 2018 to 93.1% over the first nine months of this year. Musculoskeletal therapy drugs continue to rank second (17.6% of pharmaceutical IMRs, with a 98.4% uphold rate); followed by dermatological drugs, which were up to 16.6% of the prescription drug IMRs, a big jump from 10.9% in 2018, even though the uphold rate on dermatological drug request modifications so far this year has been 94.3% and remains one of the highest among all drug categories. As in 2020, Anticonvulsants accounted for about 1 out of every 10 pharmaceutical IMRs, which is up from 8.1% in 2018, when the formulary took effect, though the IMR uphold rate for anticonvulsants has increased from 80.4% in 2018 to 90.8% in the first three quarters of this year.
A small number of high-volume providers continue to account for a high percentage of the IMR requests. The top 10% of requesting physicians named in the IMR letters from the 12 months ending in September 2021 (837 providers) accounted for 82.7% of all disputed service requests resolved during that period, while the top 1% (84 providers) accounted for 39.9%. A closer look at provider concentration shows that the 10 doctors identified in the highest number of IMR decision letters issued during the 12 months ending September 30, 2021 were linked to 22,718 service decisions during that period (10.6% of the total), although 91.o% of the UR decisions involving these doctors were upheld.
CWCI continues to monitor IMR activity and will publish full-year results for 2021 once the data is available. In the meantime, CWCI members can log in to www.cwci.org and click Independent Medical Review under the Research menu to view a new page featuring a series of exhibits that will be regularly updated with quarterly IMR data.
BY/