Research
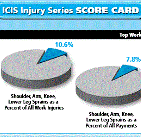
ICIS Injury Score Card: Spine Disorders with Spinal Cord or Root Involvement
CWCI research measures the growing use of drug testing in California workers’ compensation, as well as the associated billings and payments.
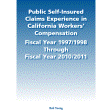
California Public Self-Insured Claim Experience, FY 97/98 Through FY 10/11
A new CWCI Report to the Industry looks at trends in California public self-insured claims experience using state data to track changes in public self-insured employers’ aggregate losses, average amounts paid and incurred per claim and claim volume over the past decade, with results measured at the first through 5th report levels. The Report is posted in the Research section.
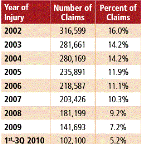
ICIS Injury Score Card: Medical Back Injuries
Medical Back Problems without spinal cord involvement represent 1 in 6 work injuries and more than a 1/4 of all workers’ comp loss dollars. A new Injury Score Card provides detailed data on claims these medical back claims.
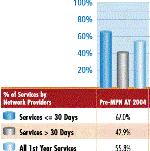
Medical Benefit Delivery in Calif. Workers’ Comp: Changes in Network Utilization and Reimbursement, AY 2004-2010
Use of medical networks in California workers’ compensation continues to grow, with new CWCI data showing that in AY 2009, network providers accounted for three-quarters of 1st year physician-based treatment and nearly 2/3 of the total paid for such services. The full study is in the Research section.
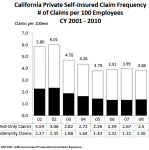
Private Self-Insured Claims Experience in California Workers’ Compensation, CY 1997-2010
A new CWCI analysis of Calif. private self-insured employers’ paid and incurred loss data compiled by the state over the past decade finds that private self-insured claims experience closely tracks the experience of the insured market, with losses rising steadily from the late 1990s until the enactment of the 2002-04 reforms, after which they registered a sharp, but short-lived decline.
California WC Medical Cost Trends, AY 2002-3Q 2010 Claims
CWCI’s latest update on California workers’ compensation medical expenses shows that average amounts paid per claim continue to rise, as average payments for treatment, pharmaceuticals and DME, medical management and cost containment, and medical-legal fees all continue to trend up, though early results for AY 2010 claims suggest the rate of medical inflation may have slowed.